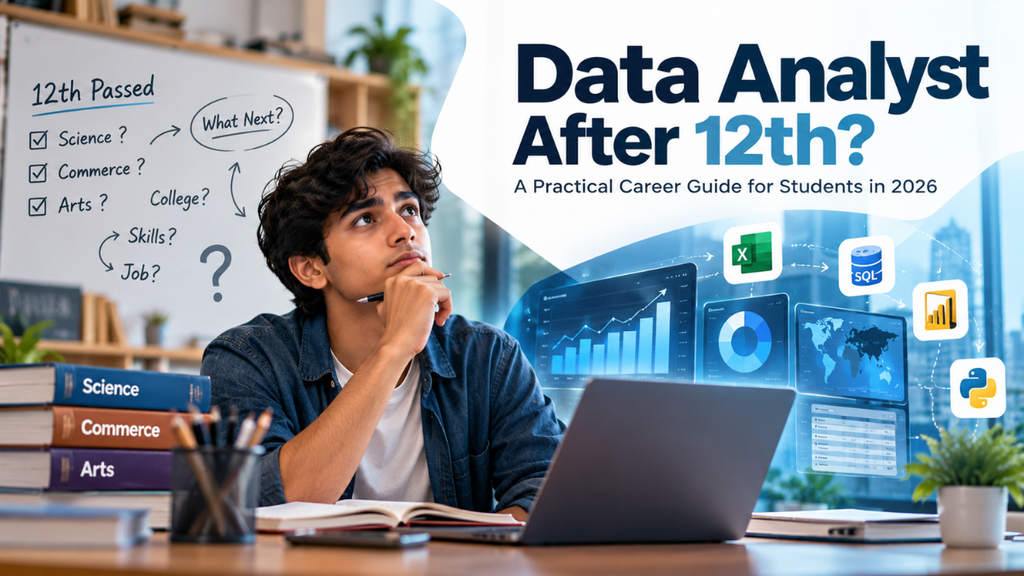
Data Analyst Course After 12th: A Practical Career Guide for Students in 2026
Your Class 12 exams are over. Your friends are discussing college admissions, entrance exams, and different career options. Meanwhile, you are wondering whether there is something useful you can learn alongside your degree.
What if you could learn to understand the numbers behind online shopping, cricket statistics, business sales, or even your monthly expenses?
That is where Data Analytics comes in.
A data analyst course after 12th gives students an opportunity to explore how information is organized, examined, and used to answer real questions. Even if you have never worked with data before, you can start by understanding simple examples from everyday life.
But there is something important to understand before enrolling: learning Data Analytics after Class 12 is possible, while getting hired as a professional Data Analyst may require additional qualifications.
This guide explains what you can learn, how to get started, and how to build a sensible career plan after school.
Can You Start Learning Data Analytics Immediately After 12th?
Yes. Completing Class 12 is enough to begin studying introductory Data Analytics concepts.
Think about a school that wants to understand why attendance has fallen over three months. The information is already available in attendance registers, but somebody needs to organize it, compare the figures, and identify patterns.
That is a simple example of analytical thinking.
You do not need to write complicated programs to begin solving such problems. You can start by entering information into Excel, creating charts, and asking questions about the results.
As your understanding improves, you can move toward databases, dashboards, and programming.
At The Data Training, students from Science, Commerce, and Arts backgrounds can begin learning Data Analytics. The important starting point is curiosity, basic computer familiarity, and a willingness to practise.
Which Students Can Choose Data Analytics After Class 12?

Your school stream does not have to determine whether you can learn Data Analytics. However, different academic backgrounds can give you different starting advantages.
Science Students: Turn Numbers into Useful Findings
Imagine you have recorded daily temperatures for a school science project.
Instead of simply presenting the readings, you could calculate weekly averages, identify the hottest days, and create a chart showing temperature changes.
This is a small but meaningful introduction to data analysis.
Students who studied Mathematics may find some statistical concepts familiar. Those without advanced Mathematics can begin with averages, percentages, comparisons, and basic graphs.
Commerce Students: Understand Business Through Data
Suppose a local stationery shop records sales of notebooks, pens, and school bags.
A Commerce student could examine which products generate the most revenue, which months are busiest, and how discounts affect total sales.
This connects classroom subjects such as accounting and business studies with practical analytical work.
For students exploring a data analyst after 12th commerce pathway, business reporting can be an accessible place to begin.
Arts Students: Explore Patterns in People and Society
Consider a student conducting a survey about how teenagers spend time on social media.
The student collects 100 responses, groups them by activity, and compares the results.
Which platform is used most frequently? Do preferences differ between age groups? How many students use social media for educational purposes?
These questions can be investigated using basic data analysis.
Arts students interested in research, psychology, economics, communication, or social issues can use analytical techniques in areas they already enjoy.
A data analyst course after 12th can be a starting point for students from different academic backgrounds, provided they are willing to build their analytical skills.
What Should You Learn First in a Data Analyst Course After 12th?
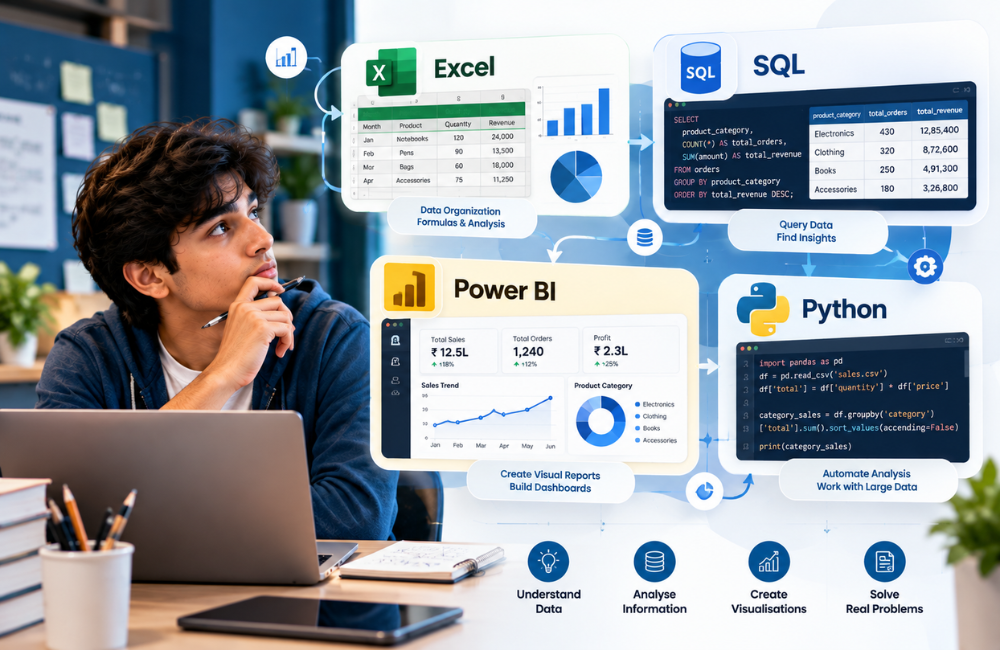
One common mistake beginners make is trying to learn every popular tool at the same time.
A more practical approach is to learn one tool, use it to solve a small problem, and then introduce the next.
1. Excel: Your First Workspace for Data
Start with a spreadsheet containing information you understand.
For example, create a table showing 30 days of personal spending. Add columns for date, category, amount, and payment method.
Then try answering three questions:
- Which expense category costs the most?
- How much did you spend each week?
- What percentage of your total spending went toward food?
This exercise introduces formulas, sorting, filtering, and charts without overwhelming you.
2. SQL: Learn to Ask Questions from Databases
Imagine that a shopping website stores thousands of orders.
Opening every record manually would be inefficient. SQL allows you to retrieve specific information from a database.
You might ask the database to show orders above ₹2,000 or calculate the total sales for a particular month.
Begin with simple queries before moving to multiple tables and more complex calculations.
3. Power BI: Present Information Visually
Once you understand spreadsheets, you can explore Power BI.
Suppose you have six months of sales records from a fictional clothing store.
Instead of presenting a large table, you could create a dashboard showing monthly revenue, bestselling categories, and regional sales.
The challenge is not simply making attractive charts. It is choosing visuals that help someone understand what is happening.
4. Python: Expand What You Can Analyze
Python becomes useful when you want to automate repetitive tasks or work with more complex datasets.
You might use it to clean inconsistent entries, combine multiple files, or calculate results across thousands of rows.
There is no need to master Python before learning Excel or SQL. Develop confidence with the fundamentals and build gradually.
5. Communication: Explain What the Numbers Mean
Imagine your dashboard shows that weekend sales are higher than weekday sales.
A useful analyst does more than point at the chart. They explain the finding, consider possible reasons, and identify what should be investigated next.
This ability to turn results into understandable explanations is worth practising from the beginning.
A Practical Data Analytics Learning Roadmap After 12th
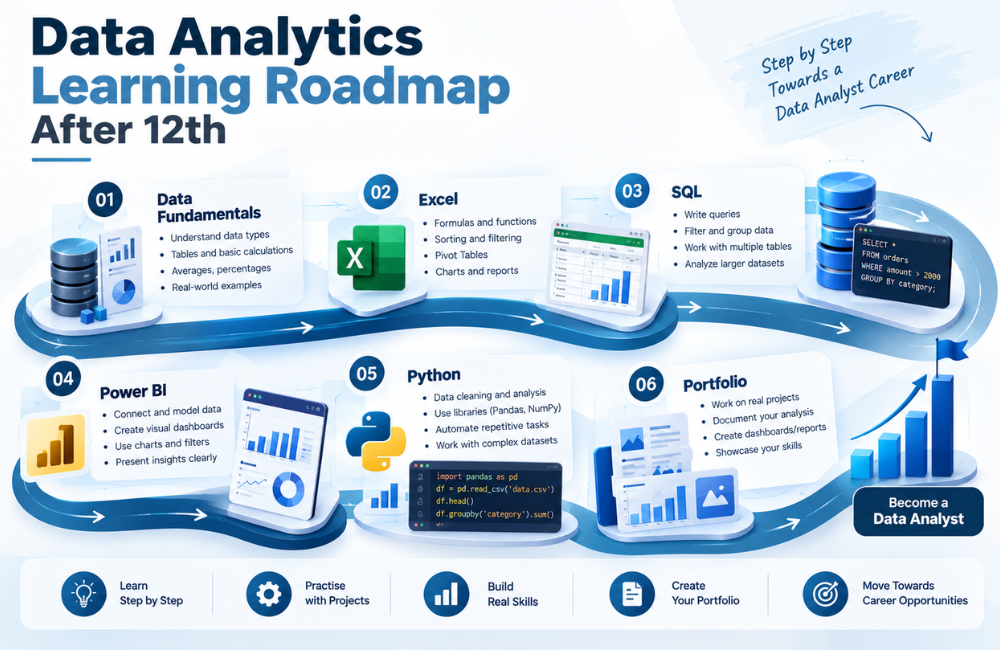
The following roadmap shows how beginners can move from basic data concepts to creating their first portfolio, one learning stage at a time.
| Learning Stage | What to Practise | Your First Output |
|---|---|---|
| Data fundamentals | Tables, percentages, averages | Simple expense summary |
| Excel | Formulas, filters, PivotTables | Monthly spending report |
| SQL | Queries, grouping, joins | Customer order analysis |
| Power BI | Data modelling and visuals | Interactive sales dashboard |
| Python | Power BI visualization | Dataset analysis notebook |
| Portfolio | Project documentation | Two or three explained projects |
You do not have to complete this entire journey within a fixed number of weeks.
A student practising regularly may progress differently from someone learning only on weekends. Focus on whether you can complete tasks independently rather than rushing through a syllabus.
Try This Beginner Data Analytics Project Before Joining a Course
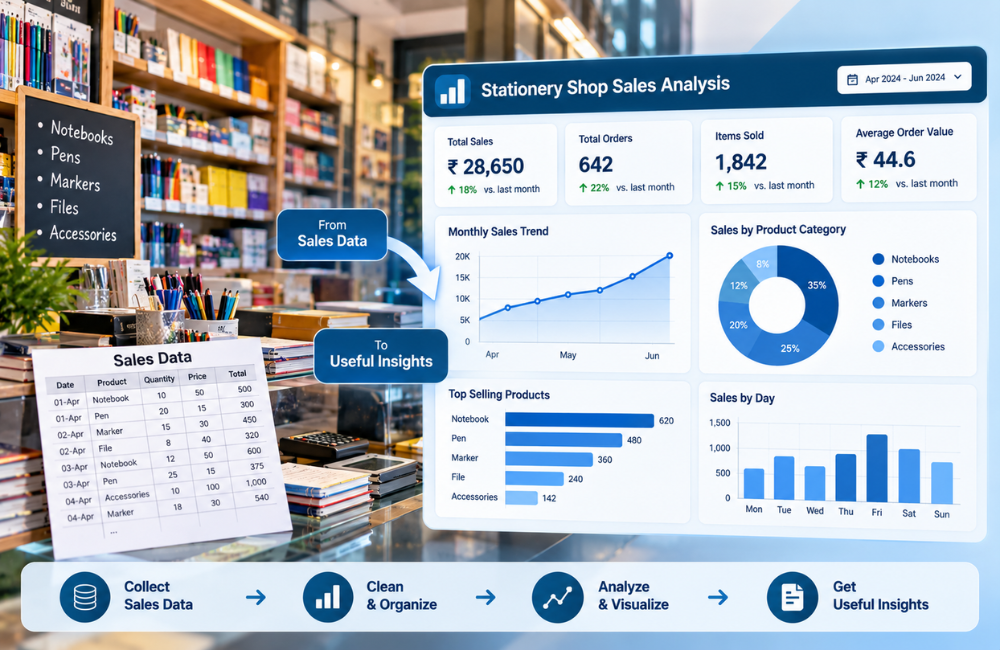
Here is a simple project you can attempt using Excel.
Project: Find Out Which Products Sell Best in a Small Shop
Create a sample dataset with 50 transactions. Include five columns:
- Transaction date
- Product name
- Quantity sold
- Price per item
- Product category
Data Analyst Course After 12th: A Practical Career Guide for Students in 2026
Your Class 12 exams are over. Your friends are discussing college admissions, entrance exams, and different career options. Meanwhile, you are wondering whether there is something useful you can learn alongside your degree.
What if you could learn to understand the numbers behind online shopping, cricket statistics, business sales, or even your monthly expenses?
That is where Data Analytics comes in.
A data analyst course after 12th gives students an opportunity to explore how information is organized, examined, and used to answer real questions. You can begin learning without being a programmer or having a college degree.
But there is something important to understand before enrolling: learning Data Analytics after Class 12 is possible, while getting hired as a professional Data Analyst may require additional qualifications.
This guide explains what you can learn, how to get started, and how to build a sensible career plan after school.
Can You Start Learning Data Analytics Immediately After 12th?
Yes. Completing Class 12 is enough to begin studying introductory Data Analytics concepts.
Think about a school that wants to understand why attendance has fallen over three months. The information is already available in attendance registers, but somebody needs to organize it, compare the figures, and identify patterns.
That is a simple example of analytical thinking.
You do not need to write complicated programs to begin solving such problems. You can start by entering information into Excel, creating charts, and asking questions about the results.
As your understanding improves, you can move toward databases, dashboards, and programming.
At The Data Training, students from Science, Commerce, and Arts backgrounds can begin learning Data Analytics. The important starting point is curiosity, basic computer familiarity, and a willingness to practise.
Which Students Can Choose Data Analytics After Class 12?
Your school stream does not have to determine whether you can learn Data Analytics. However, different academic backgrounds can give you different starting advantages.
Science Students: Turn Numbers into Useful Findings
Imagine you have recorded daily temperatures for a school science project.
Instead of simply presenting the readings, you could calculate weekly averages, identify the hottest days, and create a chart showing temperature changes.
This is a small but meaningful introduction to data analysis.
Students who studied Mathematics may find some statistical concepts familiar. Those without advanced Mathematics can begin with averages, percentages, comparisons, and basic graphs.
Commerce Students: Understand Business Through Data
Suppose a local stationery shop records sales of notebooks, pens, and school bags.
A Commerce student could examine which products generate the most revenue, which months are busiest, and how discounts affect total sales.
This connects classroom subjects such as accounting and business studies with practical analytical work.
For students exploring a data analyst after 12th commerce pathway, business reporting can be an accessible place to begin.
Arts Students: Explore Patterns in People and Society
Consider a student conducting a survey about how teenagers spend time on social media.
The student collects 100 responses, groups them by activity, and compares the results.
Which platform is used most frequently? Do preferences differ between age groups? How many students use social media for educational purposes?
These questions can be investigated using basic data analysis.
Arts students interested in research, psychology, economics, communication, or social issues can use analytical techniques in areas they already enjoy.
What Should You Learn First in a Data Analyst Course After 12th?
One common mistake beginners make is trying to learn every popular tool at the same time.
A more practical approach is to learn one tool, use it to solve a small problem, and then introduce the next.
1. Excel: Your First Workspace for Data
Start with a spreadsheet containing information you understand.
For example, create a table showing 30 days of personal spending. Add columns for date, category, amount, and payment method.
Then try answering three questions:
- Which expense category costs the most?
- How much did you spend each week?
- What percentage of your total spending went toward food?
This exercise introduces formulas, sorting, filtering, and charts without overwhelming you.
2. SQL: Learn to Ask Questions from Databases
Imagine that a shopping website stores thousands of orders.
Opening every record manually would be inefficient. SQL allows you to retrieve specific information from a database.
You might ask the database to show orders above ₹2,000 or calculate the total sales for a particular month.
Begin with simple queries before moving to multiple tables and more complex calculations.
3. Power BI: Present Information Visually
Once you understand spreadsheets, you can explore Power BI.
Suppose you have six months of sales records from a fictional clothing store.
Instead of presenting a large table, you could create a dashboard showing monthly revenue, bestselling categories, and regional sales.
The challenge is not simply making attractive charts. It is choosing visuals that help someone understand what is happening.
For additional practical guidance, explore the official Microsoft Power BI learning resources, which cover data preparation, reports, and visualizations.
4. Python: Expand What You Can Analyze
Python becomes useful when you want to automate repetitive tasks or work with more complex datasets.
You might use it to clean inconsistent entries, combine multiple files, or calculate results across thousands of rows.
There is no need to master Python before learning Excel or SQL. Develop confidence with the fundamentals and build gradually.
Once you are comfortable with basic programming concepts, the official Python Tutorial provides a useful reference for learning the language.
5. Communication: Explain What the Numbers Mean
Imagine your dashboard shows that weekend sales are higher than weekday sales.
A useful analyst does more than point at the chart. They explain the finding, consider possible reasons, and identify what should be investigated next.
This ability to turn results into understandable explanations is worth practising from the beginning.
A Practical Data Analytics Learning Roadmap After 12th
Rather than measuring progress only by the number of lessons completed, use small projects to test what you have learned.
| Learning Stage | What to Practise | Your First Output |
|---|---|---|
| Data fundamentals | Tables, percentages, averages | Simple expense summary |
| Excel | Formulas, filters, PivotTables | Monthly spending report |
| SQL | Queries, grouping, joins | Customer order analysis |
| Power BI | Data modelling and visuals | Interactive sales dashboard |
| Python | Power BI visualization | Dataset analysis notebook |
| Portfolio | Project documentation | Two or three explained projects |
You do not have to complete this entire journey within a fixed number of weeks.
A student practising regularly may progress differently from someone learning only on weekends. Focus on whether you can complete tasks independently rather than rushing through a syllabus.
For a broader understanding of the profession and its responsibilities, you can also explore the Microsoft Data Analyst Career Path.
Try This Beginner Data Analytics Project Before Joining a Course
Here is a simple project you can attempt using Excel.
Project: Find Out Which Products Sell Best in a Small Shop
Create a sample dataset with 50 transactions. Include five columns:
- Transaction date
- Product name
- Quantity sold
- Price per item
- Product category
Next, calculate the revenue generated by each transaction.
Group the transactions by product category and compare the totals. Create a bar chart showing which category earned the most revenue.
Finally, write a short explanation of your findings.
For example, you might discover that notebooks account for the highest revenue, while pens are purchased more frequently.
These are two different findings. One describes revenue; the other describes sales frequency.
Understanding that difference is part of learning to think like an analyst.
You can later improve the project by adding discounts, inventory levels, or monthly comparisons.
A small project completed carefully can teach more than watching several tutorials without practising.
Is a College Degree Necessary for a Data Analyst Career?
You can learn Data Analytics without first completing graduation. However, employers decide their own recruitment requirements.
Many professional Data Analyst vacancies ask for a bachelor’s degree or equivalent relevant experience.
This means students should distinguish between two goals:
Goal 1: Learn Data Analytics after 12th.
You can begin developing technical and analytical skills while preparing for college.
Goal 2: Build a long-term career as a Data Analyst.
For this, completing a suitable degree, building a portfolio, gaining practical experience, and preparing for interviews can improve your opportunities.
Depending on your interests and college eligibility, you might explore BCA, B.Sc., B.Com., BBA, or another degree.
There is no single compulsory graduation subject for every Data Analyst job.
The best decision is to select an academic path that suits your interests while continuing to develop practical skills.
What Career Opportunities Can You Explore?
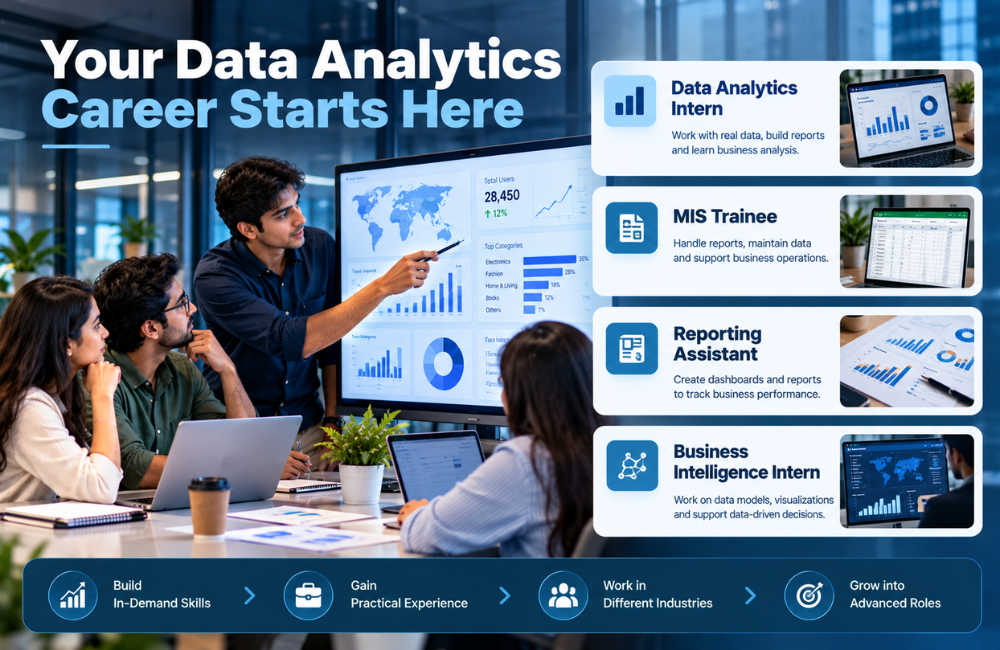
After building foundational skills, students can start exploring internships, supervised projects, and beginner-level reporting work.
Possible roles to research include Data Analytics Intern, MIS Trainee, Reporting Assistant, and Business Intelligence Intern.
Internship requirements vary by company, so students should compare available opportunities based on their current qualifications and practical skills.
Students should also avoid assuming that a course certificate guarantees employment.
Your ability to explain a project, demonstrate your tools, and meet the employer’s qualifications will matter.
If you want to understand compensation at the beginning of an analytics career, explore The Data Training’s article Data Analyst Salary in India for Freshers in 2026.
How to Choose a Data Analytics Course After 12th
A course should help you move from understanding concepts to using them independently.
Before enrolling, ask the training provider to show you the syllabus and explain how students practise.
Look for practical assignments, instructor feedback, beginner-friendly explanations, and opportunities to work with realistic datasets.
These questions reveal more about the learning experience than a long list of software names.
You should also consider whether the schedule works alongside your college studies, whether the course begins at a suitable level, and what kind of guidance is available when you get stuck.
For students comparing a data analyst course in Gurgaon, accessibility, teaching quality, practical assignments, and learning format are useful considerations.
Learn Data Analytics with The Data Training
If you have completed Class 12 and want to explore Data Analytics, The Data Training provides a learning pathway for beginners from different academic streams.
The focus should be on helping beginners understand real business problems, practise analytical thinking, and gradually become confident working with data.
The Data Training is led by Shishir Kumar, an experienced professional in development, data, and technical training.
Whether you are preparing to enter college, already studying for a degree, or exploring a new career direction, you can begin by understanding the fundamentals and practising with datasets.
Students interested in classroom training in Gurgaon or online learning can explore the available options and discuss their current skill level with the training team.
Explore the Data Analyst Course at The Data Training and find a suitable starting point for your learning journey.
Final Thoughts
You do not need to decide your entire career immediately after Class 12.
If you are interested in understanding numbers, investigating questions, and discovering patterns, Data Analytics is a field worth exploring.
Your first step does not have to be perfect. What matters is choosing a learning direction that matches your interests and staying consistent as your skills develop.
A data analyst course after 12th can provide structure and guidance, while college education and practical experience can help you prepare for future career opportunities.
The most useful first step is not collecting certificates. It is discovering whether you enjoy working with data and learning how to solve problems with it.
Contact The Data Training to explore available learning options.